
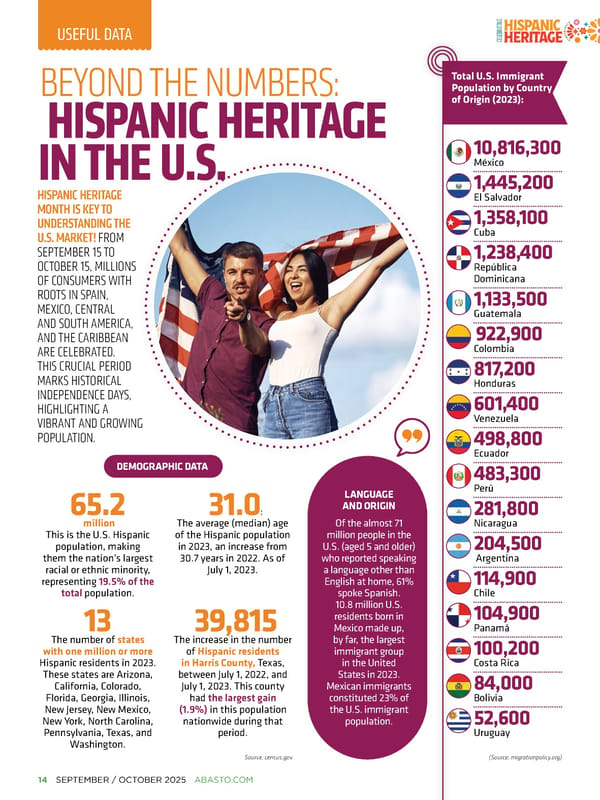
14�SEPTEMBER / OCTOBER 2025�ABASTO.COM 65.2 million This is the U.S. Hispanic population, making them the nation’s largest racial or ethnic minority, representing 19.5% of the total population. HISPANIC HERITAGE IN THE U.S. BEYOND THE NUMBERS: HISPANIC HERITAGE MONTH IS KEY TO UNDERSTANDING THE U.S. MARKET! FROM SEPTEMBER 15 TO OCTOBER 15, MILLIONS OF CONSUMERS WITH ROOTS IN SPAIN, MEXICO, CENTRAL AND SOUTH AMERICA, AND THE CARIBBEAN ARE CELEBRATED. THIS CRUCIAL PERIOD MARKS HISTORICAL INDEPENDENCE DAYS, HIGHLIGHTING A VIBRANT AND GROWING POPULATION. LANGUAGE AND ORIGIN Of the almost 71 million people in the U.S. (aged 5 and older) who reported speaking a language other than English at home, 61% spoke Spanish. 10.8 million U.S. residents born in Mexico made up, by far, the largest immigrant group in the United States in 2023. Mexican immigrants constituted 23% of the U.S. immigrant population. (Source: migrationpolicy.org) 10,816,300 México 1,445,200 El Salvador 1,358,100 Cuba 1,238,400 República Dominicana 1,133,500 Guatemala 922,900 Colombia 817,200 Honduras 601,400 Venezuela 498,800 Ecuador 483,300 Perú 281,800 Nicaragua 204,500 Argentina 114,900 Chile 104,900 Panamá 100,200 Costa Rica 84,000 Bolivia 52,600 Uruguay 31.0: The average (median) age of the Hispanic population in 2023, an increase from 30.7 years in 2022. As of July 1, 2023. 39,815 The increase in the number of Hispanic residents in Harris County, Texas, between July 1, 2022, and July 1, 2023. This county had the largest gain (1.9%) in this population nationwide during that period. 13 The number of states with one million or more Hispanic residents in 2023. These states are Arizona, California, Colorado, Florida, Georgia, Illinois, New Jersey, New Mexico, New York, North Carolina, Pennsylvania, Texas, and Washington. Source: census.gov DEMOGRAPHIC DATA Total U.S. Immigrant Population by Country of Origin (2023): USEFUL DATA
 Abasto Magazine: September/October 2025 ENGLISH Page 13 Page 15