
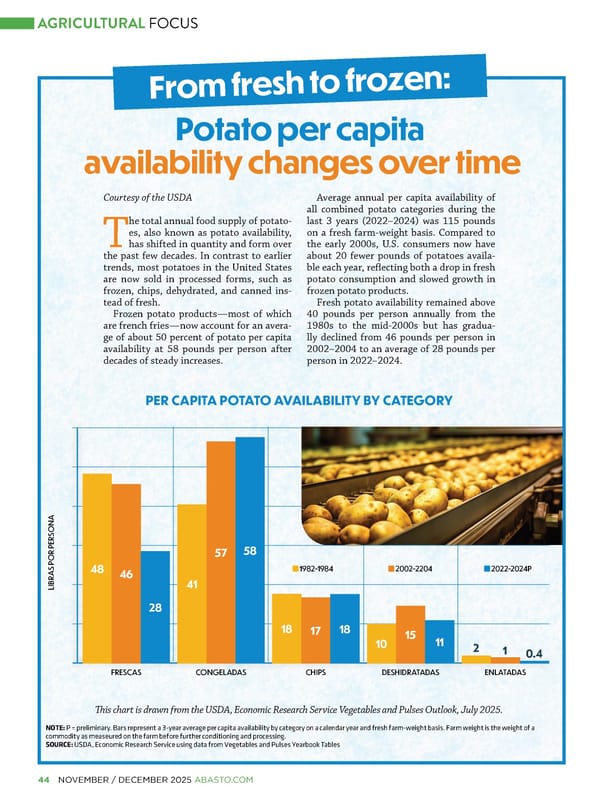
44�NOVEMBER / DECEMBER 2025 ABASTO.COM Courtesy of the USDA T he total annual food supply of potato- es, also known as potato availability, has shifted in quantity and form over the past few decades. In contrast to earlier trends, most potatoes in the United States are now sold in processed forms, such as frozen, chips, dehydrated, and canned ins- tead of fresh. Frozen potato products—most of which are french fries—now account for an avera- ge of about 50 percent of potato per capita availability at 58 pounds per person after decades of steady increases. Average annual per capita availability of all combined potato categories during the last 3 years (2022–2024) was 115 pounds on a fresh farm-weight basis. Compared to the early 2000s, U.S. consumers now have about 20 fewer pounds of potatoes availa- ble each year, refecting both a drop in fresh potato consumption and slowed growth in frozen potato products. Fresh potato availability remained above 40 pounds per person annually from the 1980s to the mid-2000s but has gradua- lly declined from 46 pounds per person in 2002–2004 to an average of 28 pounds per person in 2022–2024. From fresh to frozen: Tis chart is drawn from the USDA, Economic Research Service Vegetables and Pulses Outlook, July 2025. NOTE: P = preliminary. Bars represent a 3-year average per capita availability by category on a calendar year and fresh farm-weight basis. Farm weight is the weight of a commodity as measeured on the farm before further conditioning and processing. SOURCE: USDA, Economic Research Service using data from Vegetables and Pulses Yearbook Tables PER CAPITA POTATO AVAILABILITY BY CATEGORY FRESCAS CONGELADAS CHIPS DESHIDRATADAS ENLATADAS LIBRAS POR PERSONA 48 46 28 41 57 58 18 17 18 10 15 11 2 1 0.4 1982-1984 2002-2204 2022-2024P Potato per capita availability changes over time AGRICULTURAL FOCUS
 Abasto Magazine November/December 2025 ENGLISH Page 43 Page 45